TL;DR:
- Structured performance monitoring is key to long-term trading success.
- Tracking key metrics like expectancy and drawdown helps adjust strategies proactively.
- Consistent review routines prevent emotional trading and build survivable trading systems.
Most retail traders focus relentlessly on finding better entries, refining setups, and boosting their win rate. Yet 90% of retail traders lose money over the long term, even those running strategies with strong short-term win rates. The issue is rarely the strategy itself. It is the absence of structured performance monitoring that separates traders who survive and scale from those who blow up quietly and repeatedly. This guide breaks down why disciplined monitoring is essential, which metrics actually matter, and how consistent review processes build the foundation for lasting results in FX, indices, and crypto markets.
Table of Contents
- Why performance monitoring is essential for traders
- Core performance metrics every trader should track
- How disciplined monitoring transforms real trading outcomes
- Common traps, expert nuances, and edge cases in performance monitoring
- Our take: What disciplined performance monitoring really unlocks
- Take the next step: Tools and resources for smarter trading
- Frequently asked questions
Key Takeaways
| Point | Details |
|---|---|
| Monitoring reveals your edge | Tracking key metrics uncovers whether trading success is due to skill or luck and exposes areas for improvement. |
| Expectancy beats win rate | Focusing on expectancy over win rate prevents costly mistakes and highlights strategies with better risk-reward profiles. |
| Structured workflows drive discipline | Daily, weekly, and monthly reviews ensure traders catch problems early and adapt effectively to changing markets. |
| Avoid data traps | Overemphasizing win rates or chasing too much data can lead to poor decisions; use a balanced, tailored approach. |
Why performance monitoring is essential for traders
Now that you know why most retail traders struggle, the next question is clear: what is the missing link between effort and results? For most traders, that link is structured performance monitoring.
Real-time monitoring enables faster and better decisions in volatile markets by giving you an objective view of what your strategy is actually doing. Without it, you are reacting emotionally instead of analytically. You might hold losing trades too long, cut winners short, or increase position size after a lucky streak, all behaviors that feel rational in the moment but compound into account-destroying patterns.
Monitoring also answers a critical question: is your edge real, or have you just been lucky? Luck and skill can look identical over 20 trades. Over 200 trades with consistent metric tracking, the difference becomes undeniable. Traders who track key trading performance metrics systematically can identify exactly when their strategy stops working and adapt before a drawdown becomes a disaster.
Consider what disciplined monitoring does in practice:
- Cuts losses faster by revealing when drawdown limits are approaching
- Optimizes position sizing by exposing risk-adjusted return patterns
- Reduces emotional trading by replacing gut feel with objective data
- Identifies regime changes in market behavior before they erode equity
- Separates execution quality from strategy quality so you fix the right problem
“Monitoring separates luck from edge by revealing true returns and execution quality, vital in FX and crypto markets.”
Research shows that retail traders without disciplined oversight earn worse than -36% returns on average, a figure that reflects not just bad strategy but poor feedback loops. Without data, you cannot learn. Without learning, you cannot improve. The trading insights blog at DayProp covers how structured feedback loops are built into professional evaluation frameworks, precisely because monitoring is not optional for funded traders. It is the foundation.
Core performance metrics every trader should track
Understanding why monitoring matters is a strong start, but what should you actually track every single day? Here is a breakdown of the metrics that serious traders use across FX, indices, and crypto.
According to best practices for strategy evaluation, the following metrics form a complete performance picture when reviewed together:
| Metric | Definition | Robust benchmark | Primary purpose |
|---|---|---|---|
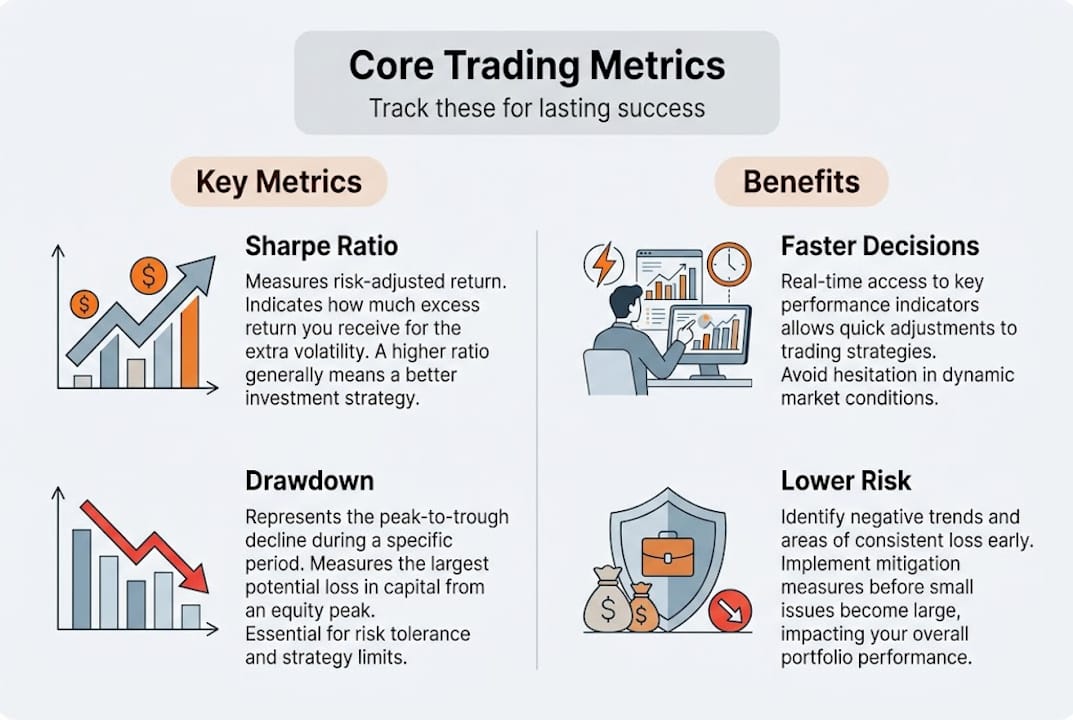
| Sharpe ratio | Return per unit of total risk | Above 1.0 | Overall risk-adjusted performance |
| Sortino ratio | Return per unit of downside risk | Above 1.5 | Penalizes bad volatility only |
| Max drawdown | Largest peak-to-trough equity drop | Below 10% for prop | Survivability check |
| Profit factor | Gross profit divided by gross loss | Above 1.5 | Strategy reliability |
| Expectancy | Average gain per trade dollar risked | Positive and stable | True edge measurement |
| Win rate | Percentage of winning trades | Context-dependent | Psychological reference only |
| Slippage | Difference between expected and actual fill | Minimized | Execution quality check |
The most important insight in this table is the benchmark for win rate: context-dependent. Win rate alone tells you almost nothing about whether you will make money. A trader with a 70% win rate but a 1:0.5 risk-reward ratio loses money systematically. A trader with a 40% win rate but a 1:3 risk-reward ratio builds equity consistently.
This is why expectancy matters more than win rate. Expectancy combines win rate, average win size, and average loss size into one number that tells you what your strategy earns per dollar risked on average. If that number is positive and stable across a large sample, your edge is real.
Pro Tip: Track your performance metric examples across rolling 30-trade windows rather than monthly calendar periods. This smooths out noise and reveals whether your edge degrades as markets shift.
For traders in FX trading best practices, the Sortino ratio deserves particular attention. FX markets often produce asymmetric volatility, meaning the Sortino ratio catches tail risk that the Sharpe ratio can mask. Always use both together, never in isolation.
Track Sharpe, Sortino, max drawdown, profit factor, expectancy, win rate, slippage, and net P&L as a connected system, not as isolated numbers.
How disciplined monitoring transforms real trading outcomes
Once you know what metrics to monitor, consistent application is where the real transformation happens. Most traders review performance occasionally, after a bad week or a blown account. Disciplined traders build structured checkpoints into their routine.
A practical monitoring schedule looks like this:
- Daily: Review net P&L, drawdown status, and whether any trades breached predefined risk limits. This catches execution errors and emotional decisions fast.
- Weekly: Analyze win rate, profit factor, and expectancy across the week’s trades. Compare to prior weeks to detect early performance decay.
- Monthly: Conduct a full risk management review, assess whether the current strategy fits the prevailing market regime, and adjust position sizing rules if needed.
This structured monitoring approach is what separates traders who survive drawdowns from those who let small losses compound into catastrophic ones. A drawdown is not a failure. It is information. The question is whether you are positioned to read it correctly and act on it.

Pro Tip: Set a hard rule that if your weekly drawdown exceeds 3% of account equity, you reduce position size by 50% for the following week automatically. This mechanical response removes emotion from your worst moments.
The data on undisciplined traders is sobering. The median annual net loss for active unmonitored retail traders sits around -$750, with the most active traders performing worst of all. More activity without feedback is not practice. It is repeated error.
Common mistakes that structured monitoring prevents:
- Revenge trading after losses, detected through drawdown velocity spikes
- Overtrading during low-volatility periods, visible through declining expectancy
- Strategy drift, where traders unconsciously change their approach without realizing it
- Ignoring execution costs, which erode edge invisibly without slippage tracking
Understanding skill vs luck in your results requires enough data and the right metrics. Monitoring gives you both. Without it, you are navigating without instruments.
For risk management basics, the principle is simple: protect capital first, grow it second. Monitoring enforces that order every single day.
Common traps, expert nuances, and edge cases in performance monitoring
Disciplined monitoring is not foolproof. Even experienced traders fall into specific traps that undermine the process. Knowing these edge cases in advance keeps your monitoring system honest.
The most common trap is overweighting win rate. Win rate is seductive because it feels like a direct measure of skill. It is not. A trader who wins 80% of trades but holds losers until they are catastrophic can destroy an account faster than one winning only 40% of the time.
“A high win rate without positive expectancy is not an edge. It is a slow bleed.”
Another often-overlooked issue is infrastructure. High CPU and RAM usage on a VPS environment causes slippage and degraded order execution that appears in your performance data as strategy underperformance. If you use an automated system and your metrics suddenly worsen without a clear market reason, check your execution environment before you change your strategy.
Other technical and analytical traps include:
- Small sample size fallacy: Judging a strategy on fewer than 100 trades produces statistically unreliable conclusions
- Correlation blindness: Running multiple strategies or instruments that are correlated makes drawdowns appear independent when they are not
- Overfitting metrics: Adjusting your strategy specifically to improve one metric can degrade overall edge
- Data overload: Tracking too many metrics simultaneously leads to analysis paralysis and indecision
- Recency bias in reviews: Weighting recent performance too heavily distorts longer-term patterns
For traders managing crypto trading risk management, correlation risk is particularly acute. Bitcoin and major altcoins often move together in stress scenarios, meaning what looks like a diversified portfolio can behave like a single concentrated bet during high-volatility events.
The antidote is discipline in the monitoring process itself. Choose a core set of five to seven metrics. Review them consistently. Let the patterns speak across a meaningful sample before drawing conclusions. A trading system built for survivability values process integrity over short-term metric perfection.
Our take: What disciplined performance monitoring really unlocks
After years operating in live markets, one truth stands out clearly: most traders chase better numbers instead of building better processes. They optimize their Sharpe ratio for last quarter’s market rather than building a system that adapts to next quarter’s conditions.
The real endpoint of trading is not a perfect system. It is a system that survives being wrong repeatedly and still compounds equity over time. Monitoring is the tool that keeps you calibrated to that goal.
The traders who perform best in structured evaluations are not necessarily those with the highest win rates. They are the ones who draw down less, recover faster, and recognize regime changes early. Monitoring gives them that situational awareness.
Do not let your metrics become a scorecard for ego. Use them as a diagnostic tool. The goal is pattern recognition in your own behavior and process, not chasing arbitrary benchmarks. If you focus on growing a trading account with consistent, process-driven discipline, the metrics will reflect that over time.
Take the next step: Tools and resources for smarter trading
Ready to apply disciplined monitoring to your own trading? The frameworks covered in this guide work best when embedded into a structured evaluation environment with clear rules and real accountability.
DayProp provides exactly that. The platform is built around performance-based evaluation, professional risk parameters, and funding models that reward consistency over luck. You can compare trader funding models to find the structure that fits your trading style, or review the full trading evaluation process guide to understand how metrics are applied in real funding decisions. For traders ready to demonstrate their edge with institutional-level capital behind them, explore all trader resources and funding options at DayProp.
Frequently asked questions
What is performance monitoring in trading?
Performance monitoring in trading is the ongoing measurement and review of trading metrics, returns, and risk factors to guide real-time decisions and long-term strategy. It enables real-time decision-making and consistent risk control across changing market conditions.
Which performance metrics are most important for retail traders?
Sharpe and Sortino ratios, maximum drawdown, profit factor, and expectancy are the core metrics for retail traders. Expectancy is most predictive of lasting success because it measures true edge rather than surface-level win frequency.
How often should traders review their performance metrics?
Traders should review P&L and drawdown daily, analyze expectancy and profit factor weekly, and conduct full regime checks monthly. Structured daily and weekly monitoring prevents small performance issues from compounding into account-damaging patterns.
Can focusing on win rate hurt my trading?
Yes. Prioritizing win rate without accounting for payoff ratio and expectancy can create a false sense of security and expose you to large, unmanaged losses. Win rate is often misleading as a standalone measure of trading edge.
Why do most retail traders still lose despite using metrics?
Most retail traders do not apply metrics within a structured, disciplined review process and fail to adapt in real time. 90% of retail traders lose money long-term, often because they fall into traps like overfitting data or suffering from information overload without actionable frameworks.