

Trading market indices without clear boundaries can leave even the most motivated traders exposed to devastating losses. When you set a written plan and strict risk limits, emotional decisions no longer dictate your results, and your discipline becomes your main shield. By focusing on personal risk tolerance and robust performance reviews, you lay the groundwork for consistent funding, protect your capital, and build long-term confidence in every trade.
Table of Contents
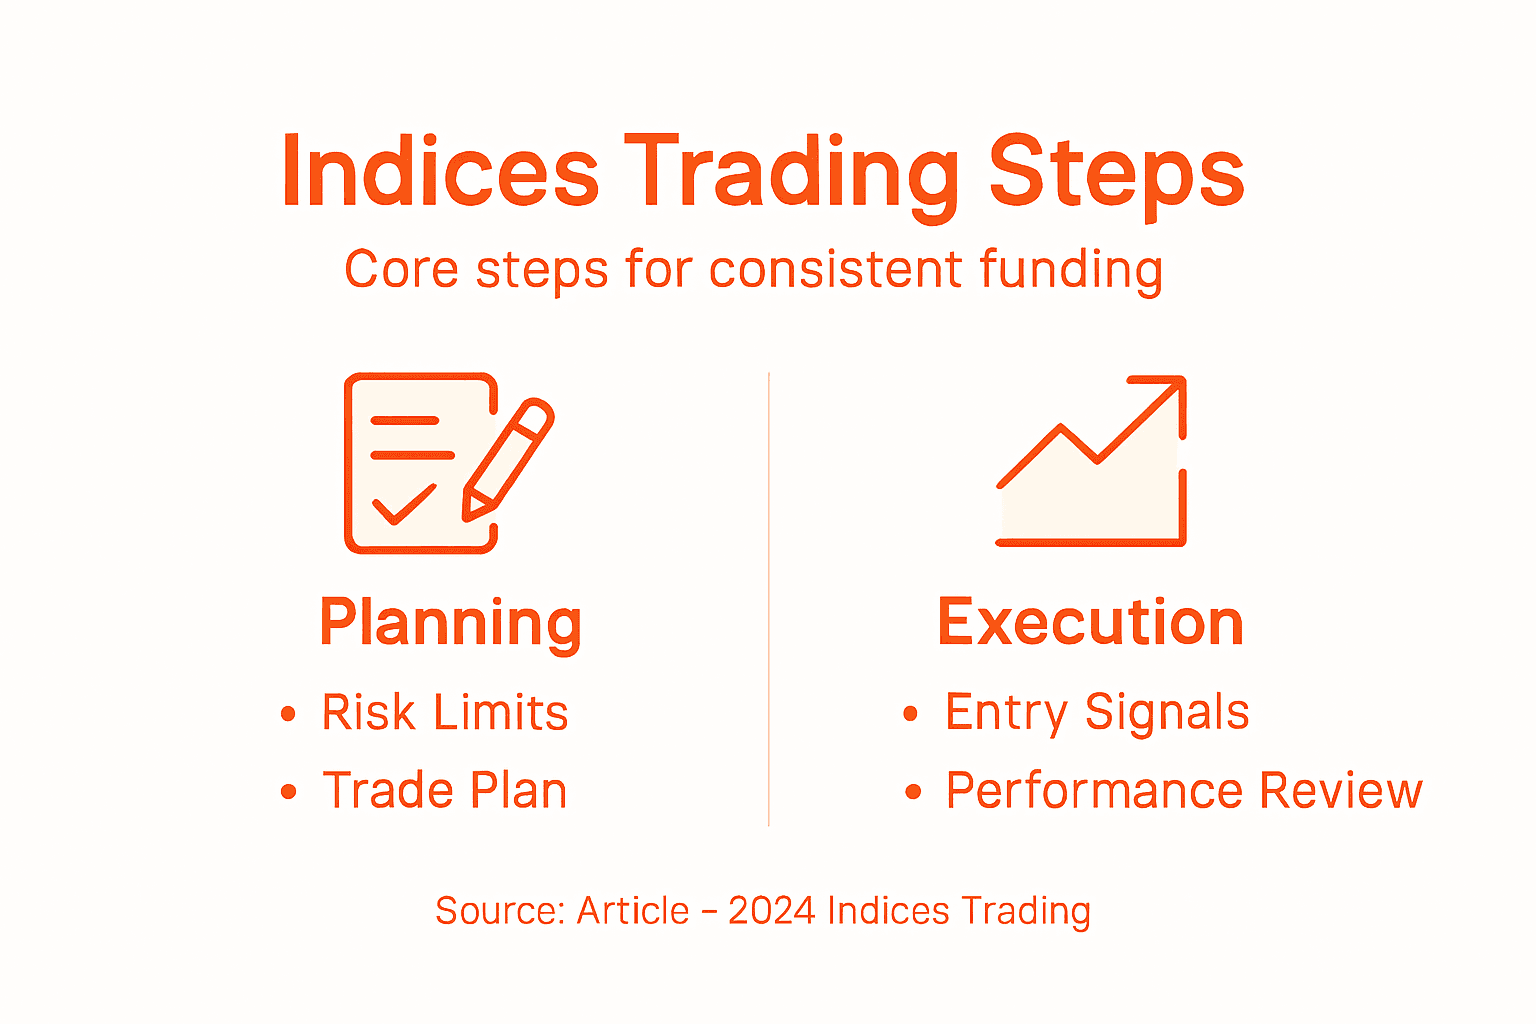
- Step 1: Define Your Trading Plan And Risk Limits
- Step 2: Analyze Key Market Indices For Entry Signals
- Step 3: Execute Trades With Disciplined Strategies
- Step 4: Review Performance And Adjust Your Approach
Quick Summary
| Key Point | Explanation |
|---|---|
| 1. Define Risk Limits Clearly | Establish maximum loss thresholds to maintain control and avoid emotional trading decisions. Knowing your personal risk tolerance is crucial to successful trading. |
| 2. Analyze Market Indices for Signals | Monitor major indices to identify entry opportunities and align trades with market trends. This helps you avoid trades against the broader market direction. |
| 3. Execute Trades with Discipline | Follow a checklist before entering trades, setting stop losses and targets to protect your capital and prevent impulsive decisions during trading. |
| 4. Review Performance Regularly | Evaluate your trading history to identify patterns and make informed adjustments to your strategy. This is essential for improving and adapting your trading methods. |
Step 1: Define your trading plan and risk limits
Defining your trading plan and risk limits is the foundation of consistent funding in indices trading. Without clear boundaries, you’ll make emotional decisions that drain your account faster than you can recover. This step establishes the rules you’ll follow regardless of market conditions.
Start by understanding your personal risk tolerance. This is different from your account size or profit goals. Risk tolerance reflects how much volatility you can handle psychologically without abandoning your strategy. Some traders sleep fine with a 5% daily loss; others panic at 1%. Know yourself honestly.
Next, determine your maximum loss per trade and per day. Most funded traders use these parameters:
- Maximum loss per single trade: 1-2% of your account
- Maximum daily loss before stopping: 3-5% of your account
- Maximum weekly loss: 8-10% of your account
These aren’t arbitrary numbers. They protect your funding from catastrophic drawdowns. If you lose 10% of your account in one week, recovering to breakeven requires an 11% gain. Recovery gets harder with bigger losses.
Position sizing flows directly from your risk limits. Risk management strategies like position sizing help you control losses while maintaining consistent performance. Your position size determines how much of your account you risk on each trade.
Calculate your position size using this formula: (Account Risk Limit × Account Size) ÷ Points at Risk per Trade = Number of Contracts. If your account is $10,000, your per-trade risk limit is 2%, and your trade risk is 20 points, you’d trade 1 contract.
Write down your specific plan with exact numbers. Vague plans fail under pressure. Your written plan should answer these questions:
- What is your daily loss threshold before you stop trading?
- How many points of risk can you accept per trade?
- What position size follows from that risk?
- Which indices will you trade?
- What time frames match your strategy?
A written trading plan isn’t optional—it’s your protection against emotional decisions that cost real money.
Pro tip: Review your risk limits every two weeks and compare them against your actual trading results to identify if your limits are realistic or need adjustment based on your current performance.
Step 2: Analyze key market indices for entry signals
Analyzing key market indices reveals entry opportunities by showing you where institutional money is flowing and what the broader market is doing. Your individual trade setups matter less if the market environment works against you. This step teaches you to read the indices like a roadmap.
Start by tracking the major indices that match your trading focus. If you trade US-based indices, monitor the S&P 500, Nasdaq 100, and Dow Jones Industrial Average. If you trade European indices, watch the FTSE 100 and DAX. Global stock market indices serve as benchmarks indicating overall market conditions and economic health, which directly influences individual trading opportunities.

Look at these three time frames for each index:
Here’s a quick reference comparing how different time frames serve your index analysis:
| Time Frame | Primary Use | Typical Insights Provided |
|---|---|---|
| Daily Chart | Confirm market trend direction | Major trends and structure |
| 4-Hour Chart | Detect momentum, support/resist | Entry zones, momentum shifts |
| 1-Hour Chart | Fine-tune trade execution timing | Short-term entry/exit cues |
- Daily chart: Shows the overall trend and market structure
- 4-hour chart: Reveals intermediate momentum and support/resistance zones
- 1-hour chart: Identifies immediate entry and exit points
Identify the current market trend on your daily chart first. Is the index moving up, down, or sideways? A trending market gives you directional clarity. Sideways markets require tighter risk management because price whipsaw happens frequently.
Next, find entry signals using price action and technical patterns. Look for breakouts above resistance, bounces off support, or momentum shifts. When the index confirms a move with volume, that confidence transfers to individual stock positions within that index.
Compare the index behavior to your specific trading setup. Your trade must align with the index direction. Trading a long position in a single stock while the Nasdaq is breaking down rarely works. You’re fighting the larger current.
Mark your key price levels where the index has paused or reversed before. These levels act as magnets for price. When your trade reaches these levels, expect increased volatility and decision points.
Watch for divergences between indices as warning signals. If the Nasdaq makes a new high but the S&P 500 doesn’t follow, that weakness often precedes a pullback. Conversely, synchronized strength across multiple indices confirms uptrends.
Index analysis removes emotion from entries by showing you objectively whether market conditions support your trade or oppose it.
Pro tip: Set price alerts on your major indices 30 minutes before your trading session starts so you catch significant overnight moves and adjust your bias before entering any positions.
Step 3: Execute trades with disciplined strategies
Executing trades with discipline separates profitable traders from account-blowers. Discipline means following your plan even when emotions scream otherwise. This step shows you how to transform your strategy from paper to real execution without abandoning your rules.
Start by writing out your trade entry checklist. Before you click buy or sell, verify these conditions are met:
- Index direction aligns with your trade direction
- Price is at your planned entry level
- Your stop loss and take profit are set before entry
- Position size matches your risk calculation
- Market conditions haven’t shifted against your bias
Don’t skip this checklist. It takes 30 seconds and prevents 80% of impulsive trades that drain accounts. Successful trading relies on disciplined behavior and systematic approaches to respond effectively to market conditions.
Once you enter, set your stops and targets immediately. Never adjust these orders based on emotions or price movement. Your stop loss protects your capital. Your take profit locks in gains before greed takes over. This is non-negotiable discipline.
Use limit orders for entries and exits whenever possible. Market orders guarantee execution but often fill at worse prices during volatile moves. Limit orders wait for your exact price, protecting your risk metrics.
During the trade, your job is simple: monitor, don’t manage. Watch your position hit your targets or stop loss. Don’t move your stop higher after the trade moves up. Don’t move your target lower as price approaches it. This second-guessing costs more money than bad entries.
Manage one trade at a time. Opening multiple positions simultaneously multiplies your risk exponentially. New traders often take 3 or 4 positions, then panic when one goes against them. Control your position count.
Document every trade you execute. Record your entry price, exit price, and why you took the trade. After your trading session ends, review your log. This review reveals patterns in your decision-making and shows what actually works for you.
Discipline during execution means executing your plan perfectly on profitable trades and unprofitable trades equally.
Pro tip: Set a 5-minute timer after each trade closes and step away from your charts before analyzing the next opportunity, forcing a cooling-off period that prevents revenge trading after losses.
Step 4: Review performance and adjust your approach
Reviewing your performance reveals what actually works versus what you think works. Most traders skip this step and repeat the same mistakes. This step teaches you to extract lessons from your trading history and evolve your strategy.
Start your review within 24 hours of your trading session. Memory fades quickly, and reviewing while details are fresh prevents rationalization. Open your trade log and examine each position you took.
For every trade, ask yourself these questions:
- Did this trade follow my written plan?
- What was my entry reason and was it valid?
- Did I exit at my predetermined target or stop?
- What emotional state was I in when I entered?
- Would I take this exact trade again tomorrow?
Measure your risk-adjusted returns not just profit percentage. A trade that risked 2% to make 1% profit is worse than a trade that risked 1% to make 2% profit, even though the first sounds more profitable. Performance evaluation helps assess the effectiveness of your trading strategy by comparing actual results against your planned risk and return targets.
Track these specific metrics weekly:
Use this performance metrics summary to track and refine your trading process:
| Metric | Why It Matters | How to Apply |
|---|---|---|
| Win Rate | Evaluates trade consistency | Target steady improvement |
| Risk-Reward Ratio | Assesses reward per risk | Prefer ratios above 1.5:1 |
| Maximum Drawdown | Measures peak-to-trough loss | Keep within set risk limits |
| Consecutive Losses | Flags streak risk | Adjust size after streaks |
| Outcome Consistency | Detects random performance | Seek predictable patterns |
- Win rate: percentage of profitable trades
- Risk-reward ratio: average profit divided by average loss
- Maximum consecutive losses: longest losing streak
- Account drawdown: largest peak-to-valley decline
- Consistency: do results repeat or vary wildly week to week?
Identify patterns in your losing trades. Do losses happen at specific times of day? Against certain index behaviors? When you skip your checklist? Write these patterns down explicitly.
Once you spot patterns, adjust one variable at a time. If you lose money trading at market open, stop trading at market open for one week. If you lose when the index diverges, add a rule requiring index confirmation before entry. Small adjustments compound into better results.
Avoid over-optimizing. Changing your strategy after every losing trade leads to whipsaw decisions. Give each adjustment at least 20 trades before evaluating its impact. One losing streak doesn’t invalidate your approach.
Compare your monthly results against your targets. If you aimed for 8% monthly return but averaged 3%, your approach needs adjustment. If you hit your target, what worked? Double down on those conditions.
Your trading journal is your feedback system. Without reviewing it, you’re flying blind.
Pro tip: Create a simple spreadsheet with columns for entry price, exit price, trade reason, and outcome, then sort by “trade reason” to see which setups actually produce profits and which consistently lose money.
Master Consistent Indices Trading with Expert Funding Support
Struggling to stick to your trading plan and maintain disciplined risk limits as outlined in “Indices Trading Strategy Steps for Consistent Funding” can feel overwhelming. You want a structured path that rewards your dedication to smart trade execution and ongoing performance review but fear risking your own capital. DayProp understands these challenges. Our platform offers a proven way to turn your disciplined approach into funded trading opportunities in indices markets through transparent rules and professional risk parameters.
Take control of your trading journey today by joining Uncategorized – DayProp Funding. Experience real-world trading conditions designed to promote education and consistency. Visit DayProp now to fast-track your path from skilled trader to funded trader supported by institutional-level capital. Your consistent strategy deserves the right backing. Start turning your market insights into scalable growth with DayProp.
Frequently Asked Questions
What should I include in my trading plan for indices trading?
Your trading plan should include your personal risk tolerance, maximum loss per trade and day, position sizing, specific indices to trade, and the time frames you’ll focus on. Start by writing down these exact parameters to keep your trading disciplined and clear.
How do I determine my risk limits in indices trading?
To determine your risk limits, assess how much of your account you’re willing to risk on each trade and day. For example, many funded traders limit their maximum loss to 1-2% per trade and 3-5% per day, enabling you to protect your capital and manage volatility.
What time frames should I analyze when trading indices?
When trading indices, analyze daily, 4-hour, and 1-hour charts. The daily chart helps confirm overall trends, the 4-hour chart detects momentum and support/resistance levels, and the 1-hour chart fine-tunes entry and exit timing for more precise trades.
How can I effectively execute trades in indices trading?
To effectively execute trades, create a trade entry checklist to ensure all conditions are met before placing a trade. This includes verifying index direction, price levels, and risk calculations to remain disciplined and improve your trading performance.
What metrics should I track to review my trading performance?
You should track metrics like win rate, risk-reward ratio, maximum drawdown, and consecutive losses along with overall consistency. For example, aim for a risk-reward ratio above 1.5:1 to ensure your profitable trades outweigh the losses over time.
Recommended
- Trading Evaluation Guide for Securing Prop Funding – DayProp Funding
- Blog – DayProp Funding
- 7 Trading Habits for Consistent Profits in FX and Crypto – DayProp Funding
- Master the Performance-Based Trading Evaluation Process Step-by-Step – DayProp Funding
- How to Optimize Investment Strategies Gold for Maximum Return