

TL;DR:
- A proper risk-reward ratio measures potential profit against potential loss using critical data points like entry, stop-loss, and take-profit prices. Its effectiveness depends on the trader’s win rate and how stops and targets are strategically placed based on technical analysis; a favorable ratio alone does not guarantee profitability. Combining disciplined risk management with market context and emotional control ensures the ratio contributes to consistent trading success.
Most traders have heard that a 3:1 risk-reward ratio is the gold standard. Few understand why that number means nothing without context. To properly explain risk-reward ratio, you need more than a formula. You need to understand how the ratio connects to your win rate, your position sizing, and the actual structure of the market you are trading. This guide covers all three, giving you a framework that improves decision-making at every stage of a trade, from planning your entry to reviewing your results.
Table of Contents
- Key takeaways
- Explaining risk-reward ratio from the ground up
- Win rate and risk-reward ratio together
- Nuances and misconceptions about a “good” ratio
- Applying risk-reward ratio in your trading strategy
- My perspective on risk-reward ratio in real trading
- Applying these concepts with Dayprop
- FAQ
Key takeaways
| Point | Details |
|---|---|
| Ratio measures trade viability | The risk-reward ratio compares potential profit to potential loss before you enter any trade. |
| Calculation requires three inputs | You need entry price, stop-loss level, and take-profit level to compute the ratio accurately. |
| Win rate determines profitability | A favorable ratio means little if your win rate falls below the required breakeven threshold. |
| Context shapes ratio reliability | Stops and targets must be placed at technically justified levels, not arbitrary price distances. |
| Integration drives consistency | Pairing the ratio with position sizing and a defined risk percentage per trade produces durable results. |
Explaining risk-reward ratio from the ground up
The risk-reward ratio compares a trade’s potential reward to its potential risk using three data points: your entry price, your stop-loss price, and your take-profit price. The ratio answers one question before you put capital on the line: does the upside justify the downside?
The core formula
For a long trade, the calculation is straightforward:
Reward = Take-Profit Price minus Entry Price
Risk = Entry Price minus Stop-Loss Price
Risk-Reward Ratio = Reward divided by Risk
A concrete numeric example makes this clear. Suppose you enter a trade at $50, place your stop-loss at $49, and set your take-profit at $52.
- Reward = $52 minus $50 = $2
- Risk = $50 minus $49 = $1
- Ratio = $2 divided by $1 = 2:1
That ratio tells you that for every dollar you risk, you stand to gain two dollars. Some platforms express this as a risk/reward ratio of 0.5:1 instead, placing risk in the numerator. Both expressions are valid as long as you apply them consistently throughout your analysis.
Here is what each input represents in practice:
- Entry price: The price at which you open the trade
- Stop-loss price: The price at which you exit to cap your loss
- Take-profit price: The price at which you exit to realize your gain
Pro Tip: Define your stop-loss and take-profit levels before you enter a trade. Planning stops and targets in advance lets you calculate the ratio objectively, without the distortion that comes from emotional decision-making once a position is open.
Win rate and risk-reward ratio together

Here is the concept that trips up most traders who are new to risk-reward analysis: a favorable ratio does not guarantee a profitable account. You can have a 3:1 ratio on every trade and still lose money consistently if your win rate is too low.
The mathematical relationship between the two is expressed through the breakeven win rate formula:
Breakeven Win Rate = 1 divided by (1 + Risk-Reward Ratio)
The table below shows how different ratios translate into the minimum win rate required to avoid a net loss:
| Risk-Reward Ratio | Breakeven Win Rate |
|---|---|
| 1:1 | 50.0% |
| 1.5:1 | 40.0% |
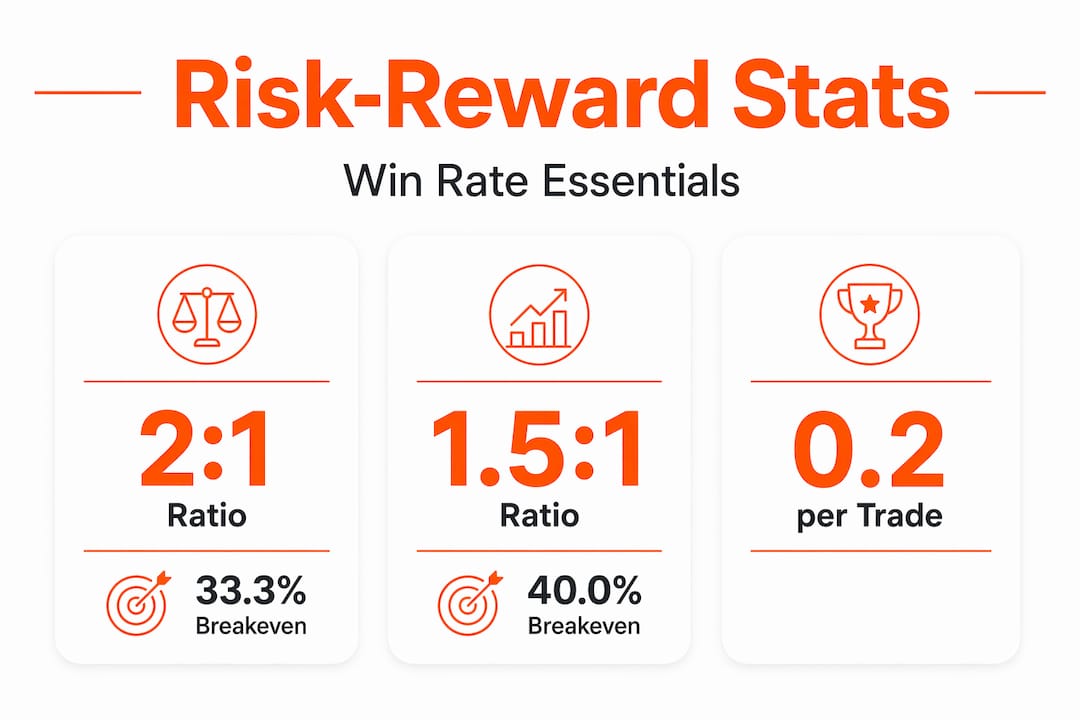
| 2:1 | 33.3% |
| 3:1 | 25.0% |
| 4:1 | 20.0% |
With a 2:1 ratio, the minimum win rate you need is approximately 33.3%. That sounds attractive, but it also means you can be wrong two out of every three trades and still break even before costs. A trader winning 40% of trades at a 2:1 ratio generates a positive expected return. A trader winning 30% of trades at that same ratio generates a loss.
Expected return per trade makes this concrete. At a 2:1 ratio with a 40% win rate: (0.40 times 2) minus (0.60 times 1) = 0.80 minus 0.60 = +0.20 units per trade. At a 30% win rate: (0.30 times 2) minus (0.70 times 1) = 0.60 minus 0.70 = minus 0.10 units per trade.
The ratio is a key input, not the whole equation. Understanding win rate’s practical importance alongside the ratio is what separates disciplined traders from those who chase setups based on numbers alone.
Pro Tip: Before committing to a trading strategy, calculate the expected return using your historical win rate and your typical ratio. If the math produces a negative number, no amount of discipline in execution will produce profits.
Nuances and misconceptions about a “good” ratio
A ratio of 3:1 printed on a chart means very little without examining how the stop-loss and take-profit were placed. This is where most early-stage traders develop blind spots.
Consider the following common mistakes:
- Placing a stop-loss extremely close to entry to manufacture a high ratio, without any technical justification for that level
- Setting a take-profit at a round number or arbitrary distance rather than at a meaningful resistance level
- Treating the ratio as a pass/fail screen for trades, ignoring whether the probability of reaching the target is realistic
A good risk-reward ratio alone does not guarantee a good trade. Probability and market context are non-negotiable inputs. A 4:1 ratio where the take-profit is placed at a strong supply zone that price has failed to break three times before is not a favorable setup regardless of the ratio printed on paper.
Stops and targets derived from chart structure, specifically from support and resistance levels, improve ratio reliability because they reflect realistic trade behavior rather than optimistic math.
“The ratio tells you the shape of the trade. Technical analysis tells you whether that shape is achievable.”
Position sizing connects directly to this. Risking 1% of account equity per trade determines how many units or contracts you trade based on the dollar distance to your stop. This keeps the monetary risk constant regardless of how wide or tight the stop is on any given setup.
Pro Tip: Use the risk-reward ratio as a decision filter, not a standalone approval metric. Combine it with a technical read on probability, your account risk percentage, and your historical win rate before taking any trade. For deeper context on managing risk parameters, it helps to understand how professional frameworks define these limits.
Applying risk-reward ratio in your trading strategy
Translating the concept into a repeatable process requires structure. The following approach works across trading styles and instruments.
Setting stops and targets using technical analysis
Start by identifying the trade setup on the chart. Mark your entry based on a signal, such as a breakout, a pullback to support, or a pattern completion. Then locate the nearest structural level that would invalidate the trade and place your stop-loss just beyond it. Set your take-profit at the next significant resistance level for longs or support level for shorts.
This sequence matters because technically justified levels reflect how price actually behaves, not how you wish it would behave.
Risk-reward ranges by trading style
Different styles produce different ratio expectations based on how long trades are held and how much noise they must absorb:
| Trading Style | Typical Risk-Reward Range |
|---|---|
| Scalping | 1:1 to 1:1.5 |
| Day trading | 1:1.5 to 1:2 |
| Swing trading | 1:2 to 1:3 |
| Position trading | 1:3 to 1:5 |
Ratio recommendations vary by trading style, with beginners often starting at 1:2 and trend traders extending to 1:3 or beyond. The longer the trade duration, the more room price has to reach an extended target, which supports higher ratios in theory. In practice, every trader should track their own historical data and measure whether their actual outcomes match their expected ratios.
Key practices for applying the ratio consistently:
- Record entry price, stop-loss, take-profit, and calculated ratio for every trade before execution
- Review actual exit prices versus planned levels after each trade to identify slippage patterns
- Adjust position size so that the dollar risk per trade stays within your defined account risk limit, typically 0.5% to 2% of equity
- Revisit your ratio distribution across a sample of at least 50 trades to assess whether your setups produce the ratios you intend
For a structured approach to forex risk management, working through a step-by-step framework helps traders apply these concepts with consistency across different market conditions.
My perspective on risk-reward ratio in real trading
I have seen traders spend weeks perfecting their ratio calculations, then blow accounts because the math never translated into execution. The ratio is a necessary tool. It is not a sufficient one.
What I have found is that the gap between calculated ratios and actual results often comes down to two things: spreads, commissions, and slippage on one side, and psychology on the other. Real trade execution deviates from calculated ratios because friction costs eat into the reward side of the equation. A 2:1 ratio after a 3-pip spread and a 2-pip slippage on a tight stop can become a 1.5:1 ratio by the time the trade closes. This is not a reason to avoid tight stops. It is a reason to stress-test your ratios using real historical fill data, not theoretical prices.
The psychology side is harder to quantify. Most traders who understand the math still move their stops under pressure, exit winners early out of anxiety, or skip trades because the ratio looks marginal even when the setup is technically sound. The ratio is only as reliable as the discipline of the person executing it.
My advice is to treat the ratio as the beginning of trade evaluation, not the conclusion. Run the breakeven win rate calculation. Map the stop and target to actual chart levels. Size the position to a fixed percentage of your equity. Then track every trade and measure actual ratios against planned ones over time. That feedback loop is where improvement happens, not in any single calculation done before entry.
— Nikola
Applying these concepts with Dayprop

Dayprop’s structured trading challenges are built around the same principles covered in this guide. The evaluation process measures whether traders apply disciplined risk parameters consistently across real market conditions, not whether they pick the right direction on any single trade. Mastering the risk-reward ratio is a direct input into passing that evaluation. Dayprop’s performance-based evaluation guide walks through exactly how these metrics are assessed and what funded traders are expected to demonstrate. For traders ready to formalize their approach and access institutional capital, the prop funding evaluation guide outlines the full pathway from preparation to payout.
FAQ
What is risk-reward ratio in simple terms?
The risk-reward ratio compares how much you stand to gain on a trade versus how much you stand to lose. A 2:1 ratio means your potential profit is twice your potential loss.
How do you calculate risk-reward ratio?
Subtract the entry price from the take-profit price to get the reward, then subtract the stop-loss price from the entry price to get the risk. Divide reward by risk to get the ratio.
What is a good risk-reward ratio for trading?
It depends on your trading style. Day traders typically target ratios between 1.5:1 and 2:1, while swing traders often aim for 2:1 to 3:1. The key is that your ratio must align with a win rate that produces a positive expected return.
Can you lose money with a high risk-reward ratio?
Yes. If your win rate falls below the breakeven threshold for your ratio, you will lose money over time regardless of how favorable the ratio looks on paper.
Why should stops and targets be based on technical analysis?
Placing stops and targets at chart-based levels such as support and resistance improves the feasibility of hitting the target and honoring the stop. Arbitrary placement distorts the ratio and produces unreliable results in live trading.
Recommended